No Images? Click here

NEW YORK CITY
SPECIAL RELEASE: Climate Matters is launching a new wind and solar energy forecasting tool that will enable broadcast meteorologists to bring daily renewable-electricity generation information into their forecasts.

Our new wind and solar forecast tool is here! See how much daily wind and solar electricity can be generated in your market based on the real-time weather.

Need a background to show the data? Download these templates to use on the air or on social media to share the daily data for your market.
We have very exciting news! Climate Central is launching a new web-based tool today that will enable TV meteorologists to incorporate wind and solar electricity information into daily forecasts.
The tool estimates how much wind and solar electricity will be generated locally and regionally under real-time weather forecast conditions. Developed in partnership with MESO Atmospheric Research Forecasting and Simulations, the tool first uses hourly observed data to estimate how much electricity was generated yesterday. Going a step further, it uses gridded numerical weather model output and estimates of installed wind turbine and solar photovoltaic capacity to forecast the electricity that will be generated today and tomorrow. Additionally, the data are scaled to determine the percentage of homes in a media market that could be powered by wind and/or solar electricity on that day.
The tool’s output also includes the percentage saved on daily electrical costs for an typical home with rooftop solar panels in the media market. Wind power is usually generated far away from urban areas, so we have included the amount of wind power generated in the Nielsen DMA as well as within the broader eGRID region that serves a particular market.
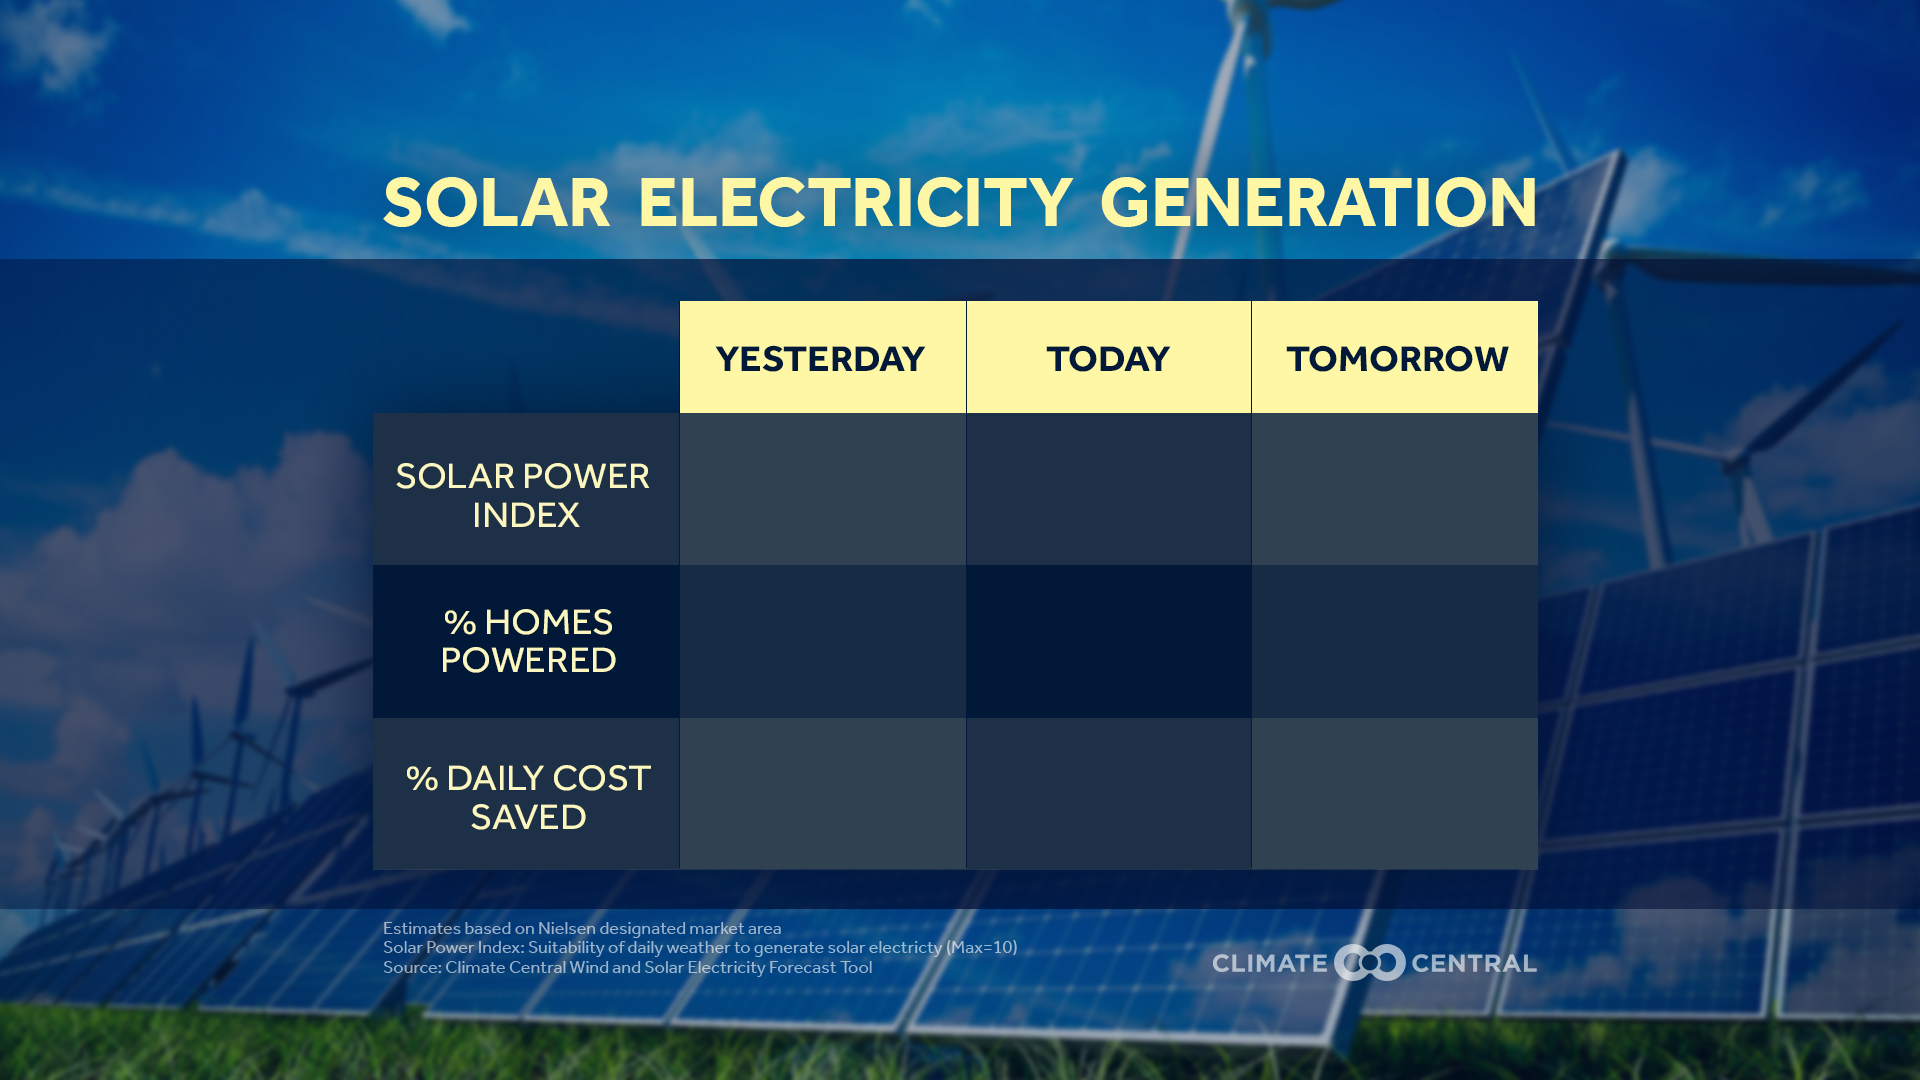
To further distill the impact of weather conditions on electricity generation, the tool reports a daily Solar Power Index (SPI) and a daily Wind Power Index (WPI). Inspired by the popular UV Index, it ranks the suitability of the weather conditions for generating wind or solar electricity on a scale from 0 to 10.
Much like other specialty forecasts (pollen forecast, bus stop forecast, UV forecast, boating forecast), the tool enables meteorologists to quickly convey how the weather will impact the daily generation of wind and solar electricity in their specific areas.
SOME WIND AND SOLAR FORECAST EXAMPLES
Expect west winds at 10-20 mph in Wichita tomorrow, which will generate enough electricity to power 30% of the homes in our area with the turbines that are already installed.
Our Solar Power Index in Phoenix is a 9 out of 10 today, and the installed solar PV capacity could power 40% of the homes in our area. A typical home with solar panels installed would save 60% on electrical costs today.
METHODOLOGY
A full methodology, including calculations and data sources can be found here.
MISS OUR WEBINAR?
You can now watch Monday’s webinar which featured two of the new wind and solar energy forecasting tool’s creators, Eric Larson from Climate Central and John Zack from MESO, at the Workshops and Webinars section of our Climate Matters Resource page.
SUPPORTING MULTIMEDIA


See more high resolution graphics and videos at our NEW searchable media library.
CLIMATE MATTERS METS IN ACTION


NASA
NASA’s POWER project is improving the current renewable energy data set and creating new data sets from new satellite systems.
CLIMATE RESEARCH
A recent modeling study suggests an increase in the number of major hurricanes in the next 20 years.
OCEAN NEWS
Move it or lose it. Global coastal wetlands may have to retreat inland to survive climate change.