No Images? Click here


With the government reopened, NOAA and NASA have released their global and national climate reports for 2018 — showing that last year was the globe’s fourth-hottest on record.


Across the globe, the past five years have been the hottest five years on record https://buff.ly/2DLMJ7F #climatematters

Happy 7th Birthday, Climate Matters! Thank you for your continued engagement — here’s to another great year!
At long last, the government is open and the year-end climate reports from NOAA and NASA are out. As expected, 2018 was the fourth-hottest year on record globally, and another near-record year for U.S. weather and climate disasters. All of the years on record that were hotter or more disaster-filled came in the past decade.
To bring context to the global goal of limiting warming to 2°C, we compare the global temperatures to an earlier, pre-industrial 1880-1910 baseline. 2018’s global temperatures were 1.90°F (1.06°C) above that baseline — more than halfway there. This made 2018 the second-warmest year on record without an El Niño event, behind only 2017. (El Niño can enhance warming, but it can’t explain all of it). Only 2016 and 2015 were warmer years, and 2014 rounds out the top five. With the five warmest years on record happening during the past five years — and the 20 warmest occurring over the past 22 — a consistent warming trend couldn’t be clearer. Meanwhile, monthly averaged atmospheric CO2 concentrations have risen to 411 ppm at Mauna Loa Observatory, thanks in part to an estimated 2.7 percent increase in global CO2 emissions from fossil fuels.
While the U.S. had its 14th-warmest year in 2018, unusual heat in Europe and the Arctic propelled the globe to higher numbers. The oceans also had their warmest year on record — a trend that intensifies sea level rise, coral bleaching, and tropical cyclones such as hurricanes.


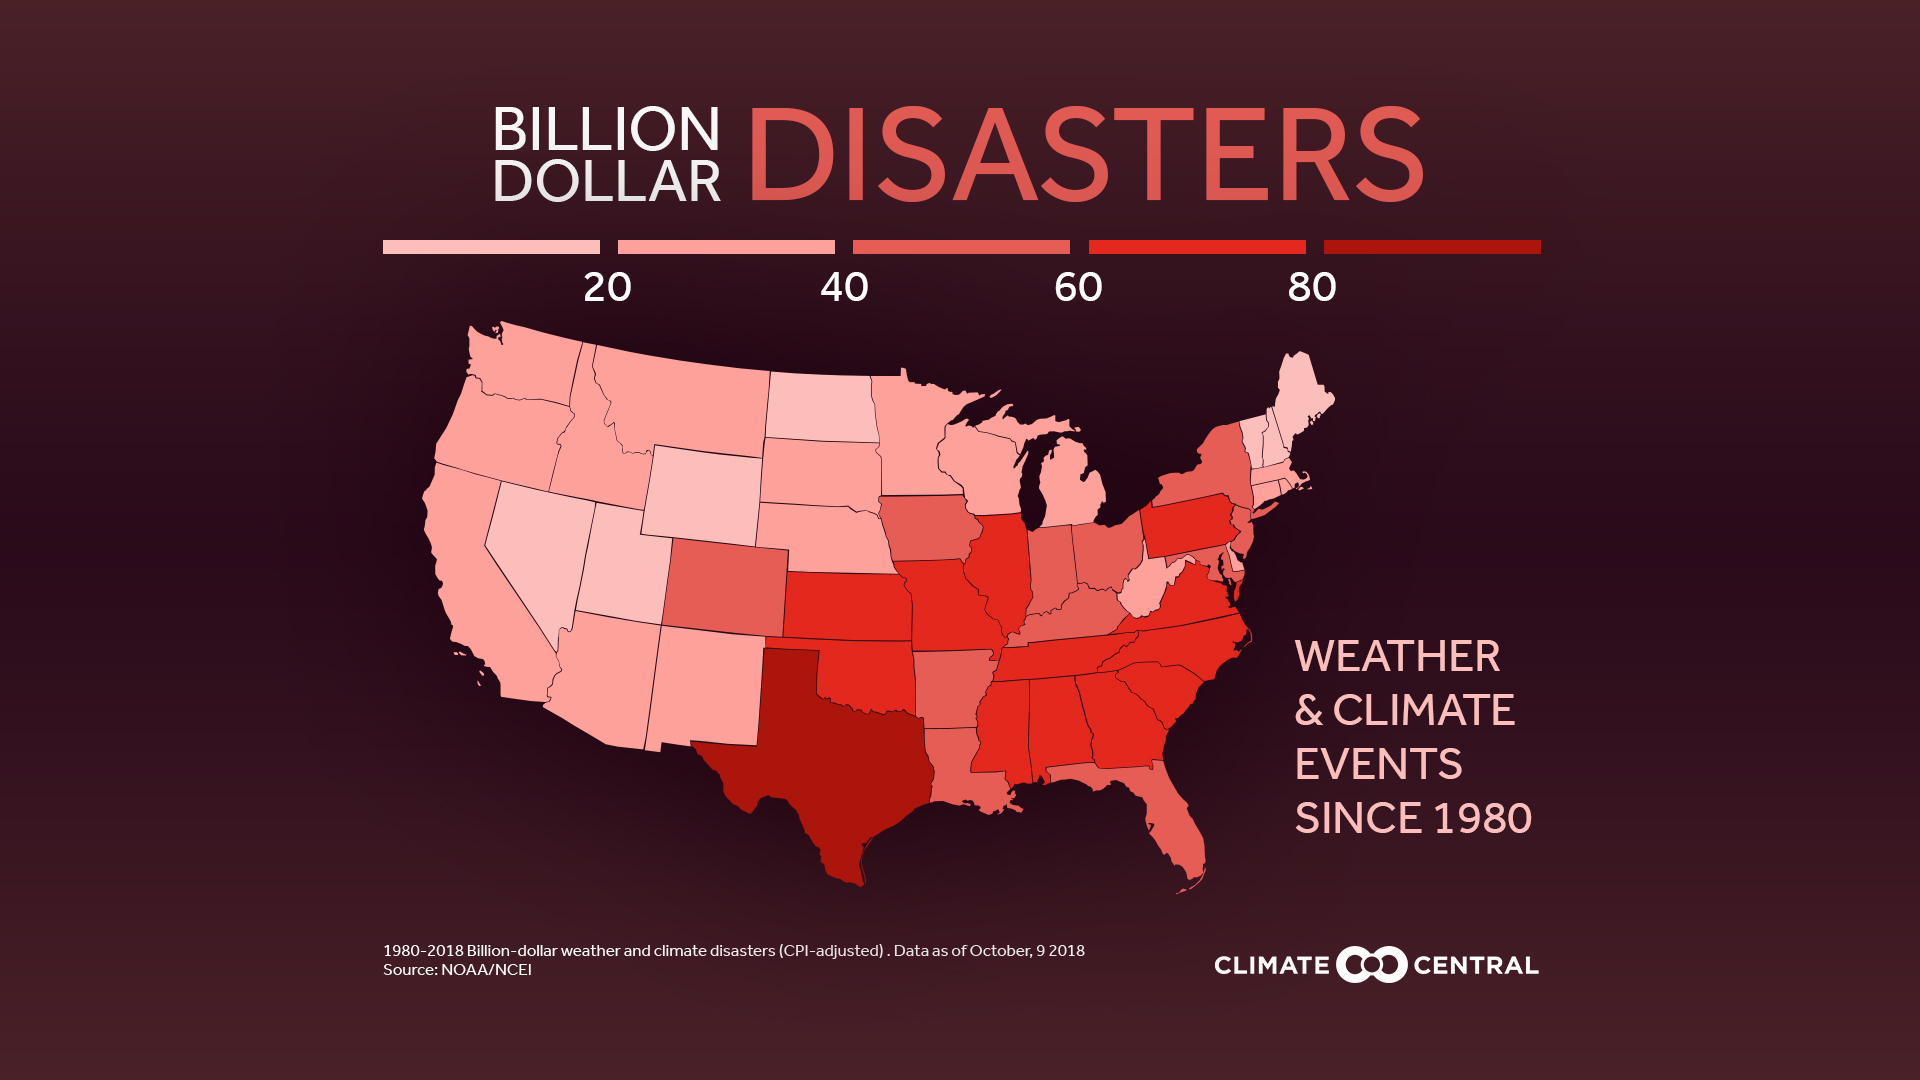
2018 saw another near-record number of billion-dollar weather and climate disasters in the U.S. https://buff.ly/2t9nibU #climatematters
Hurricanes hit the U.S. especially hard, leading 2018’s near-record list of 14 billion-dollar weather and climate disasters. Hurricanes Michael and Florence combined for at least $49 billion in damages — over half of the total from the year’s included events (cost estimates will be updated over time). In addition, the Western wildfire season was the most expensive ever, with total damages of at least $24 billion. Even the sheer number of billion-dollar events is telling — only 2011, 2016, and 2017 have had more. Unless we rapidly reduce our climate-warming emissions, these costly climate disasters will only get worse.
METHODOLOGY
Calculations of average annual global temperature are performed independently at NASA and NOAA. Small differences in their calculations arise as NASA’s calculations are extrapolated to account for polar locations with poor station coverage, while NOAA relies more heavily on the polar station data. Climate Central compares temperatures to an earlier 1880-1910 baseline to assess warming during the industrial era.
National temperatures and disaster data are provided by NOAA. Cost of the disasters has been adjusted for inflation. NOAA combines all Western wildfires together as one annual event. Additional review of the methodology can be found from Smith and Katz, 2013.
SUPPORTING MULTIMEDIA

See more high resolution graphics and videos at our NEW searchable media library.
METS IN ACTION


CLIMATE RESEARCH
Higher temperatures could lead to thousands more heart defects in U.S. newborns by 2025-2035, finds new research from the American Heart Association.
OCEAN NEWS
Here's one for the record books! Ocean robots push boundaries of technology with a year-long survey under Antarctic ice shelf.